How to Set Up Dashboards

If you are wondering what exactly is a dashboard, then in simple words a dashboard is basically a report of data that allows the manager or a business analyst to gain an overview of what the business is doing and assist them in making the right decisions. A dashboard is shown on a single page that contains the most important information that will play a major role in helping you make the right decision.
How to Create Dashboards?
Excel makes it very simple to create exceptional dashboards that will help give an insight and show the managers what needs to be the focus of their attention in a proper manner. However, you must keep in mind that creating dashboards takes an immense amount of practice and skill.
How to Create a Dashboard
The process of creating a dashboard will take up some time, but in the end it is worth it. There are many courses online that you can take where you will learn the following pieces of information:
• How to structure data with tables and data connections
• How to interact with reports using VBA and slicers
• How to gain an insight of what you are doing by analyzing charts and tables
• How to analyze data with formulas
• How to present the outcomes
The dashboards that you will most likely learn in the tutorials have been given below.
Small Business Dashboard
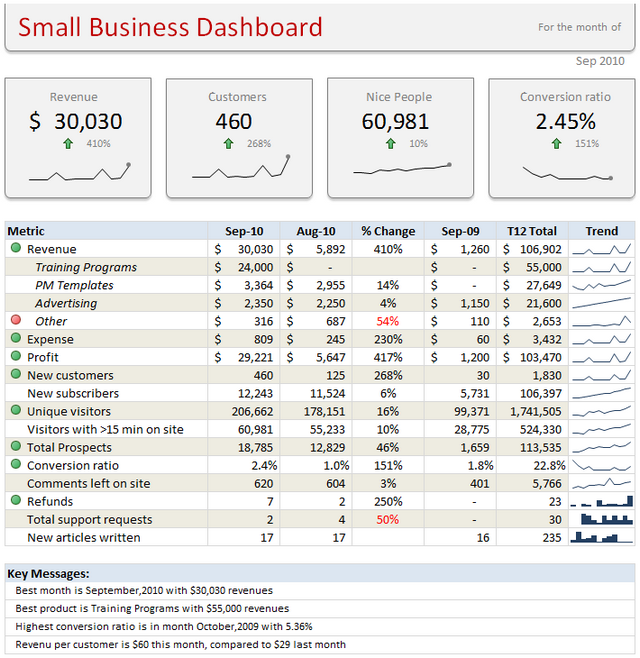
You will learn how to work with tables, sparklines, and conditional formatting.
KPI Dashboard
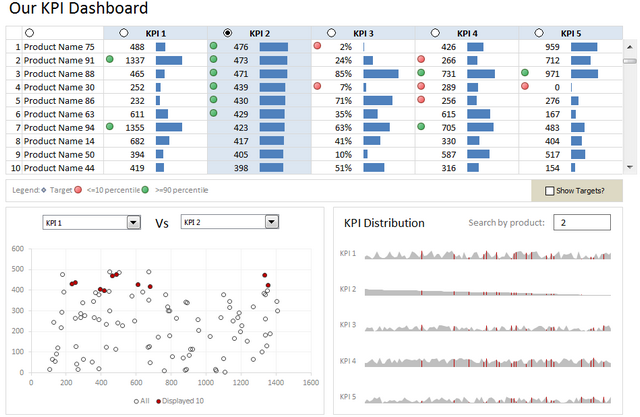
You will learn how to work with dynamic charts and will learn new layout techniques.
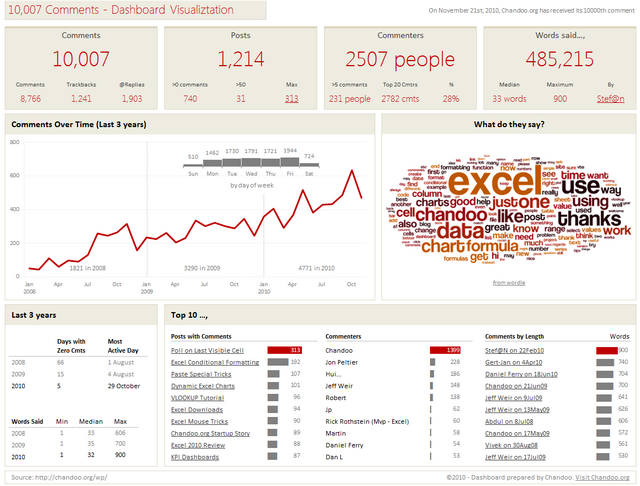
Website Dashboard
You will learn how to mix various formats and use color and contracts with dynamic charts.
Website Dashboard – 2
You will learn how to analyze data, use colors, and mix charts.
Real Estate Dashboard
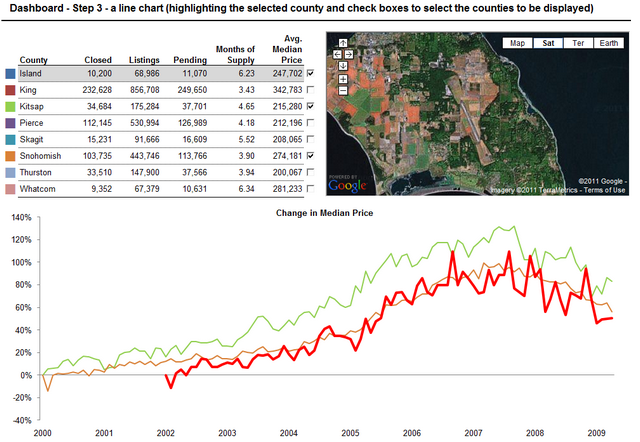
You will learn how to use maps and advanced charts.
On Demand Details Dashboard
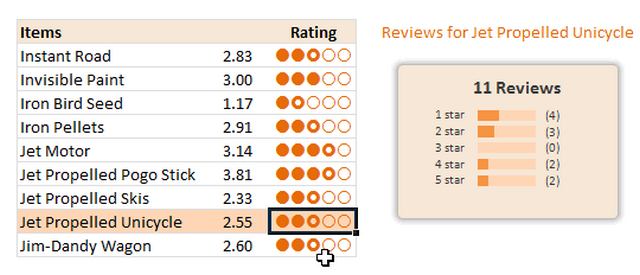
You will learn how to work with conditional formatting and charts and cells.
Sports Dashboard
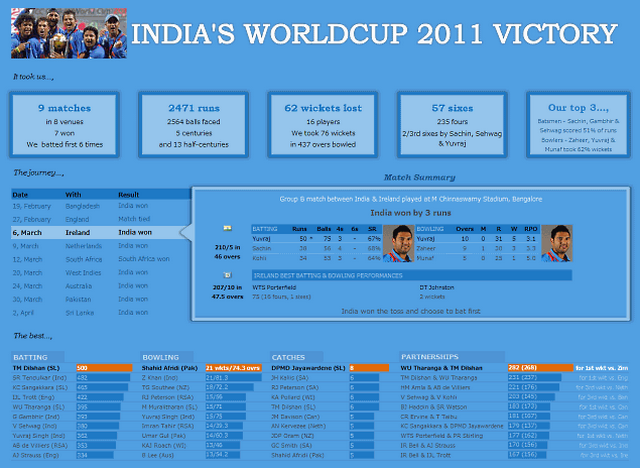
You will learn how to work with different layouts and picture links.
Simple Kpi Dashboard
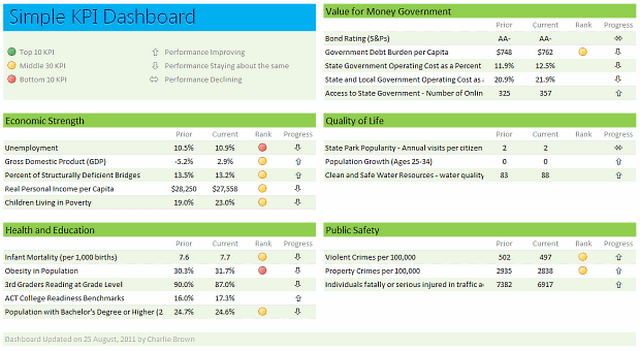
You will learn how to format data and simple layouts.
Employee Dashboard
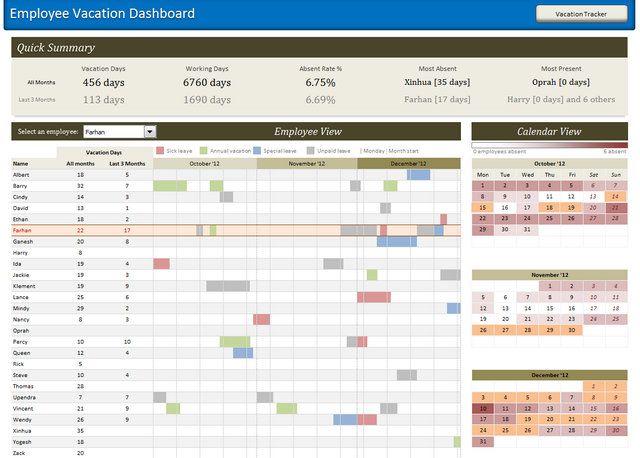
You will learn how to use tables and different layout techniques.
Store Performance Dashboard
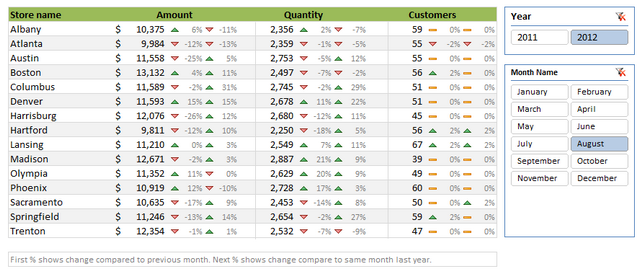
You will learn how to utilize slicers and incorporate conditional formatting.
Product Performance Dashboard
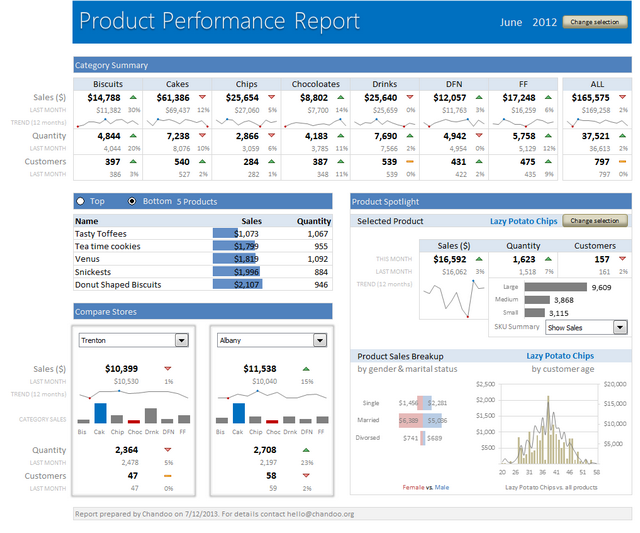
You will learn how to work with advanced charting and use DAX measure along with advanced DAX measures.

Related Tutorials
.png)
If you are running a business and wants to see how much do you sale and what is the breakup and effect of each product on your profits, this post is for you!

Power Pivot is basically an Excel tool that was first introduced to the public in the year 2010. What exactly is meant by Pow...
Our paper is designed to accommodate two-dimensional charts, or at best 3 dimensional charts. But those charts are produced at the expense of understandability and app...


Latest
-
Understanding How HYPERLINK Works In Excel
Excel has a built in function to create hyperlinks &...
-
Understanding how MS Excel Query Works
“Query” in MS Excel has same meaning as ...
-
An Introduction To Excel Power Map
Our today’s post is about “Power Map&rdq...
-
Using Pivot Charts For Displaying Data
Conventional charts are mostly used for displaying r...
-
Using “Calculated Items” For Analyzing A Pivot Table
In our last post, we explored how to use calculated ...