Extracting Meaningful Information From Raw Data – An Example Of Using Sales Data To Get Meaningful Insights
.png "Extracting Meaningful Information From Raw Data – An Example Of Using Sales Data To Get Meaningful Insights")
If you are running a business and wants to see how much do you sale and what is the breakup and effect of each product on your profits, this post is for you!
Whenever you have sales data, it is always required to get some meaningful reports from it. This could be finding the product wise total sales, monthly sales volume, year over year sales of a product, profit margins from each products and much more.
Today will see how we can setup a spreadsheet to find such parameters to make reporting easier.
We will start with a sales database (you can see the companion sheet) and extract some relevant information from it!
-
In What category we the most volume sold for year 2012?
-
In this report we have 16 Categories – but we want to find the one that had highest sales in 2012. The task can be achieved by setting up column enlisting all the categories and putting up this formula (assuming the categories in Column A)
=�SUMPRODUCT�(('Sht1'!$D$2:$D$391=2012)*('Sht1'!$F$2:$F$391=B17)*('Sht1'!$E$2:$E$391))
…and the answer is 796490 using �MAX�() function and the category is Restaurants and Take Away foods.
The formula simply validates the Column D for the Year 2012, Column F for the Category Type and Sum values from Column E.
-
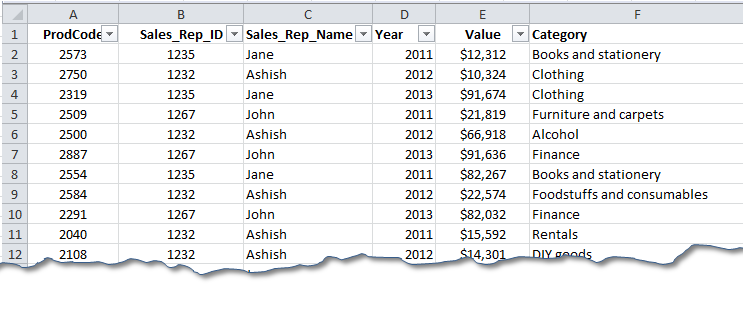
Who is the best sales man for the year 2012
The best salesman means the one who sold highest dollar amount - so we will perform summation against each of the sales man for all the categories for the year 2012.
=�SUMPRODUCT�(('Sht1'!$C$2:$C$391='Sht2'!H2)*('Sht1'!$D$2:$D$391=2012)*('Sht1'!$E$2:$E$391))
The formula validates Column C for the sales person name, Column D for the year 2012 and then sum values from Column E to give the answer. The best sales person from the report in Ashish who has sold products worth $2604643!
-
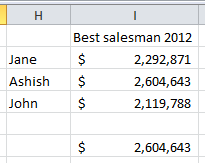
What was the year with highest sales volume?
-
For this we need to sum against each year. This formula works a treat.
=�SUMPRODUCT�((H9='Sht1'!$D$2:$D$391)*('Sht1'!$E$2:$E$391))
We have only three year data in our database – 2011, 2012 and 2013. The formula checks for the respective years in database column D and sums the values to give the answer. From our report the best year was 2011 with total sales amounting to $7218998.
-
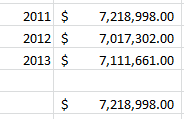
What is the improvement in the sales of Category Clothing for year 2012 and 2011?
-
Here we need to find the total sales of clothing for year 2011 first and then to compare it with year 2012. In order to calculate the total sales of Clothing for year 2011 and 2012 we will use…
=�SUMPRODUCT�(('Sht1'!$F$2:$F$391="Clothing")*('Sht1'!$D$2:$D$391=2011)*('Sht1'!$E$2:$E$391))
and
=�SUMPRODUCT�(('Sht1'!$F$2:$F$391="Clothing")*('Sht1'!$D$2:$D$391=2012)*('Sht1'!$E$2:$E$391))
Finally we calculate the percent increase/decrease with the formula: =1-(I17/I16)
The first and the second formula both checks the column F for the category clothing and column D for year 2011 and 2012 respectively and then sums the values. The final formula finds the increase or decrease over the year.
This way you can get valuable information for the raw sales data. Please download the companion worksheet to enjoy


Latest
-
Understanding How HYPERLINK Works In Excel
Excel has a built in function to create hyperlinks &...
-
Understanding how MS Excel Query Works
“Query” in MS Excel has same meaning as ...
-
An Introduction To Excel Power Map
Our today’s post is about “Power Map&rdq...
-
Using Pivot Charts For Displaying Data
Conventional charts are mostly used for displaying r...
-
Using “Calculated Items” For Analyzing A Pivot Table
In our last post, we explored how to use calculated ...