Developing And X And R Chart For Quality Control

We do create different type of charts to fulfill our charting needs – quite a few of them are related to quality control purposes. In this post we will learn how to plot a control chart for mean of a value i.e. value of a mean for some measureable quantity over time.
A little bit of theory on Statistical Quality Control:
Control chart is a statistical quality control technique to monitor the variability of a variable over a period of time. We usually monitor on two different lines for quality control:
- Monitoring Variables
- Monitoring Attributes
For this post, we will be studying charts for monitoring variables – X - Charts. X-Chart simply monitors the mean of a variable. The mean value in Statistics is represented by X, hence called mean charts.
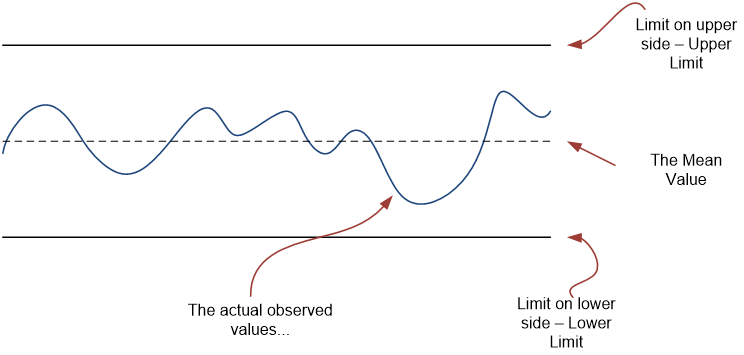
In order to calculate where should we draw the boundaries…
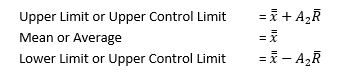
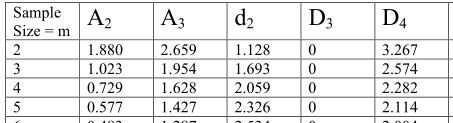
We need some formulas from the statistics textbooks to proceed. Using Montgomery’s all known book on Statistical Quality Control (or just goggling it on web), we can have these formulas:
With all this information in hand we can easily plot an X chart
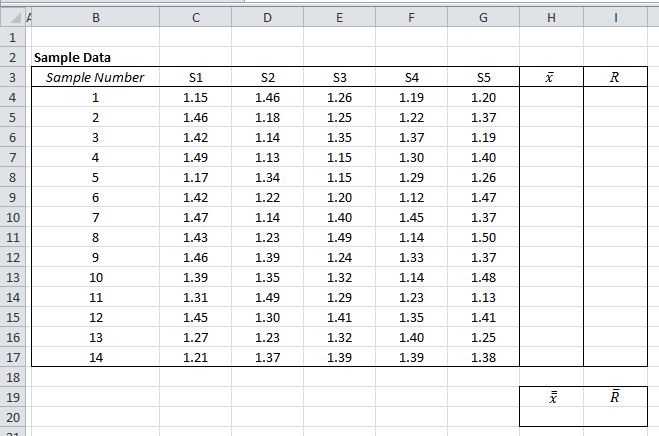
The Sample Data:
In the attached sample sheet we have the sample data.
Calculating Values:
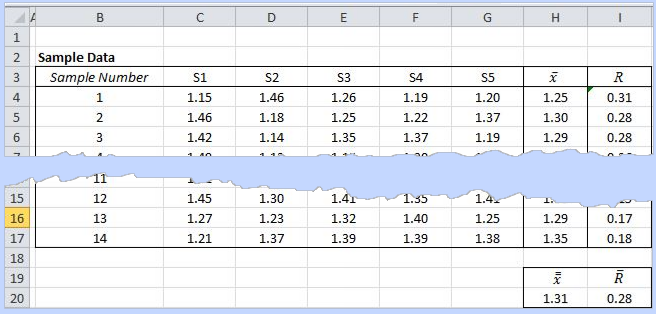
We first need to calculate the sample means, and they are calculated by averaging the values in rows. For first sample we will average out and the values in for C4:G4 and will report it in H4. The formula we will use is:
=�AVERAGE�(C4:G4)
We will again average the values in the Column H to get the value of
=�AVERAGE�(H4:H17)
We will repeat the same steps with range – range is defined as the difference of the maximum and the minimum for each sample. Hence it can be calculated as:
=�MAX�(C4:G4)-�MIN�(C4:G4)
=�AVERAGE�(I4:I17)
The final table should look like.
Finding UCL and LCL
We first need to find A2 that is available from various resources on internet, the value is found to be 0.577.
UCL =
= 1.31 + (0.577) x 0.28 = 1.47
LCL =
= 1.31 - (0.577) x 0.28 = 1.15
Plotting Chart
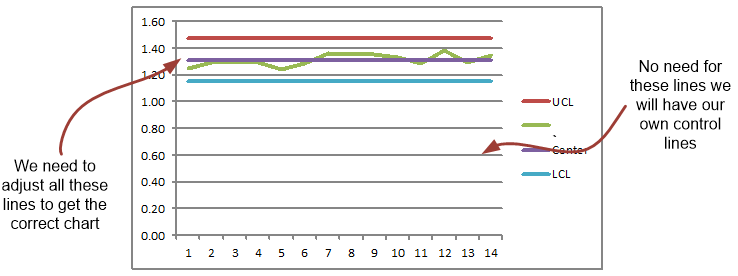
That was all about the tricky statistics calculation, now we just need to create a chart. We will use a separate range of cells on the same sheet to plot four series, three created by UCL, and LCL and the last one being the averaged values for each sample i.e.
We will select an entire table in the range K3:017 to plot a Line Chart – the resulting following chart still need to be formatted to look more appealing:
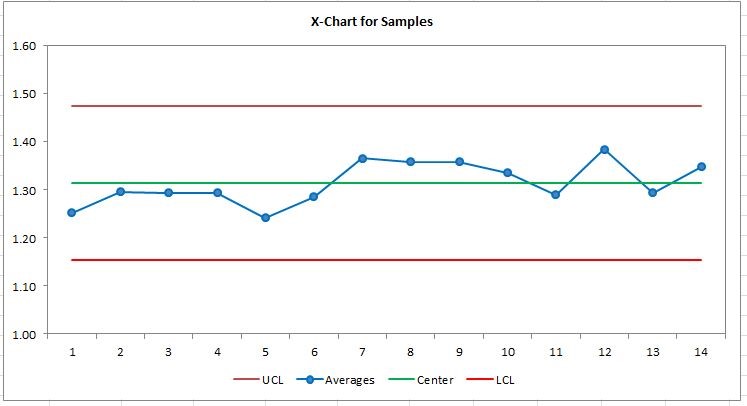
The final chart looks like:
What we have done with this:
-
Adjust maximum and minimum values for Y axis to be 1.6 and 1.0 respectively.
-
Formatted all the four series to look different.
-
Marker option used for Average value series
-
Removed gridlines - horizontal
-
Chart Title Center and Above is used
-
Legend on the bottom of the chart
-
Selected chart area and bordered with same color as that of axis’s.
That is it; we have our X-Chart in place. We can also produce a R chart and other variation chart as well with this trick.

Related Tutorials

Do you need to create new workbooks all the time and then making similar changes to all of them?

You must have come across charts that are overloaded and you find them a pain to read. Yes these are charts that look quite pretty initially but they are read and inte...

In our last post we have discussed various printing options – in this post we will continue with this the same topic and explore few more options that can help m...


Latest
-
Understanding How HYPERLINK Works In Excel
Excel has a built in function to create hyperlinks &...
-
Understanding how MS Excel Query Works
“Query” in MS Excel has same meaning as ...
-
An Introduction To Excel Power Map
Our today’s post is about “Power Map&rdq...
-
Using Pivot Charts For Displaying Data
Conventional charts are mostly used for displaying r...
-
Using “Calculated Items” For Analyzing A Pivot Table
In our last post, we explored how to use calculated ...