Using Moving Averages For Forecasting

Sales people often need to estimate the sales of upcoming months. They do it with a handful of techniques that uses both quantitative analysis as well as qualitative judgment. Thus forecasting techniques can be broadly classified into either a quantitative one or qualitative one, and we can supplement either of them with the other one.
In today’s post, we will learn how to setup a sheet for “Moving Averages”. This is one of the most commonly used techniques of forecasting and the setting up of the sheet is not quite difficult. We will try to prepare a model that forecasts based on moving averages.
There are two types of data that is being used for forecasting – intrinsic and extrinsic. The intrinsic forecasting uses firm’s historical data and the extrinsic uses factors that affect sales or consumption of goods. For this post, we will be using only extrinsic data.
Mathematics of Moving Averages:
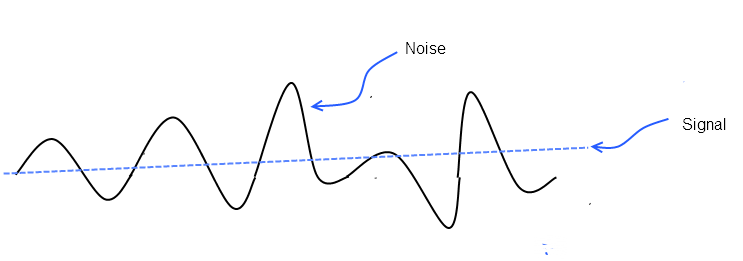
The moving average work by taking average of last n-periods to forecast the demand. Let’s consider the following screenshot of data (more in the sample file). For every moving average, there are always two parts that it consists of:
-
Signal – that represents and average value.
-
Noise – that represents deviation from the average value.
-
For the above data, there will also be a signal and noise
Implementing Moving Average:
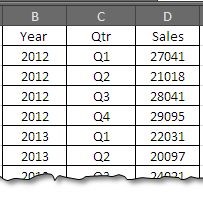
Consider the data in the sample sheet. The data usually consists of time periods in one column followed by the sales or parameter to be forecasted in the side-by column. Assuming that we want to calculate moving average for the quarterly sales figure, we have following set of data available.
Implementing Moving Average
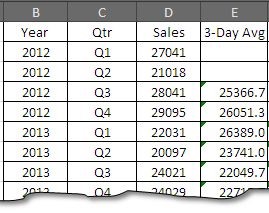
Let’s assume that we want to forecast the sales figure for the forth quarter of 2012 based on the sales of first three quarters of the year, we will simply average the last three quarter’s sale:
Q4 Sales = ( 27041 + 21018 + 28041 ) / 3 = 76100 / 3 = $25367
In excel us will use formula:
=AVERAGE(D2:D4)
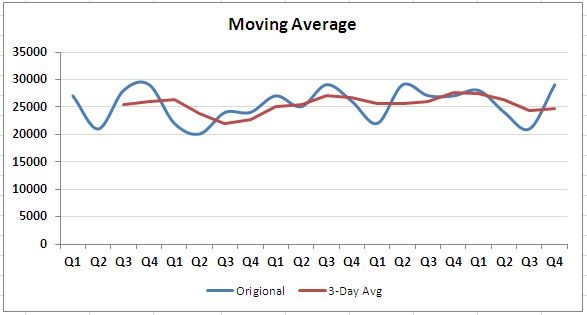
…. And drag down. The dynamic referencing will adjust the formula automatically and you have table (and the respective data plotted) like this one:
We can also take moving average on 5 day basis. For moving average on 5 day basis we will use the formula:
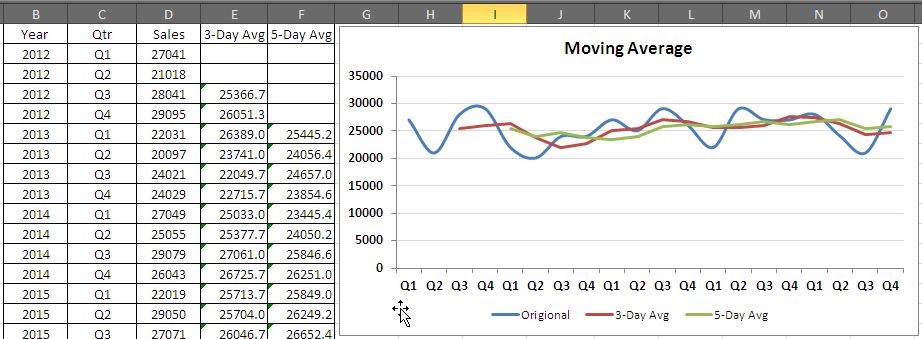
You can see that moving average become smoother with taking 5 day average.
How to find which one better represents data:
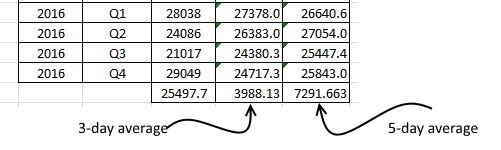
In order to find either 3 day or 5 day moving is good for you; you can measure it by using Mean Absolute Deviation in Excel. For the given data, the method will calculate the difference between the each term and mean and then sum the absolute values of the differences.
The formula that will work will look like:
=SUM(ABS(($D$22-E2:E21)))/COUNTA(E2:E21)
And
=SUM(ABS(($D$22-F2:F21)))/COUNTA(F2:F21)
From the screenshot, we can see that the result of 3 day average is smaller (hence better) then the average for 5 day. Hence we will go with the 3 day average.
Conclusion:
you can still do tricks with moving averages by assigning weightage to different periods – more recent one be given more weightage and older sale values be given smaller values and so on.
Hope you will like this tutorial; we will revert with some more useful tips in next post. Please download the sample file follow through the instruction!

Related Tutorials

Businesses are all about decision making. If you are working for a firm, whether it is producing goods or providing services, you must have come across situation where...

You know the functions and formulas but need to practive your Excel skills? Or do you need Excel Practice Te...
Both date as well as time is stored in the form of numbers in Excel. This allows the user to utilize these dates as well as times for the purpose of calculations.
...


Latest
-
Understanding How HYPERLINK Works In Excel
Excel has a built in function to create hyperlinks &...
-
Understanding how MS Excel Query Works
“Query” in MS Excel has same meaning as ...
-
An Introduction To Excel Power Map
Our today’s post is about “Power Map&rdq...
-
Using Pivot Charts For Displaying Data
Conventional charts are mostly used for displaying r...
-
Using “Calculated Items” For Analyzing A Pivot Table
In our last post, we explored how to use calculated ...