Using Data Table To Perform Analysis

MS Excel provides us with various tools to analyze the effect of change in variable on final output. With Goal Seek, we had the opportunity to find the effect of a single variable and thus calculating the value that satisfies the required condition for us, and Scenario Manager allowed us to add many more variables to our analysis. Data Tables are specifically designed to assess the changed caused by one or two variable.
With data tables, we use the existing relationship of a calculation to see how change in one variable affects the entire relationship and we are able to analyze results for spectrum of values.
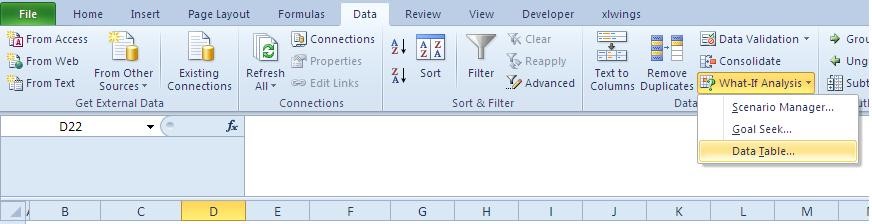
The data tables can be accesses if you have installed Analysis Tool pack, through Data > What If Analysis > Data Tables. Both one and two way data tables are produced from the same menu.
As usual, we will consider and example to see how the Tables work.
One Way Data Table:
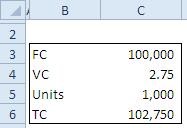
Let’s consider the example of Cost-Volume Profit Analysis where an accounting manager is interested in finding the effect of variable cost over the total cost. Referring to the companion sheet we found following data:
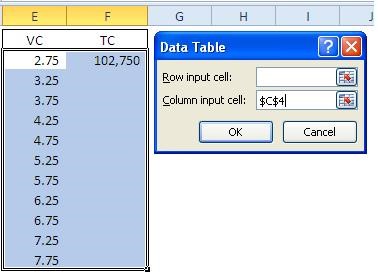
In order to setup a One Way Data Table, we first define the range of Variable Cost values. We link Cell E2 to C3 (the VC value cell) and then increment the value by 0.5 each time. The increment is done by referring to the cell C9 and fixing the reference and dragging down the formula.
Then we link the cell F3 to the total cost in cell C6. Then we reach the Data Table option and select the cell C4 that 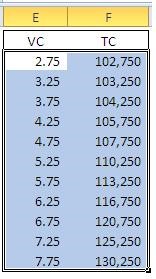 contains the value of VC, while selecting the entire table without headers.
When we press OK. We have the values of TC again all values of VC as shown in the following picture.
Two Way Data Table:
Now the manager is concerned and also wants to calculate the effect of number of units as well as the variable cost over the total cost (TC).
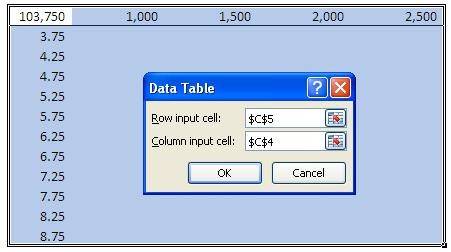
For this we setup a table with left most column bearing incremented VC values and the header column having incremented Units. The cell E2 is linked to C6 that is total cost. When setting up the table we need to refer to Row input cell as C5 because C5 contains the value for Units and for Column Input cell as C4 for it contains the values of VC, and then press Ok.
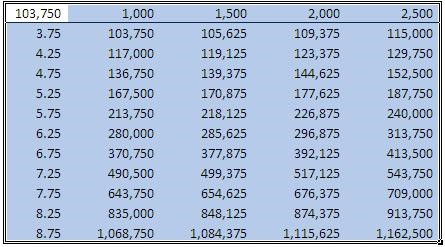
Thus with a simple trick and few clicks, we have been able to see the effect of a range of values on TC.

Related Tutorials

In business, several tools are used to analyze data. One of such tools is the histogram. The histogram is a chart, which has chart columns that signify how frequent a ...

Excel is one of the tools most of us use in our lives. It is almost impossible to tell how many things you can do with Excel.


Latest
-
Understanding How HYPERLINK Works In Excel
Excel has a built in function to create hyperlinks &...
-
Understanding how MS Excel Query Works
“Query” in MS Excel has same meaning as ...
-
An Introduction To Excel Power Map
Our today’s post is about “Power Map&rdq...
-
Using Pivot Charts For Displaying Data
Conventional charts are mostly used for displaying r...
-
Using “Calculated Items” For Analyzing A Pivot Table
In our last post, we explored how to use calculated ...