A 3 Step Guide To Make Your First Excel Based Model

There are a lot of resources available for modeling on internet, available from books to tutorial to boot-camp trainings; this one focuses more on the concept of modeling rather then discussing details of any particular field. Since things are easy to understand when we follow example we will take up an example of Economic Order Quantity to understand how a model actually works. As a first step, we must understand how a financial model works.
Any model can broadly be divided into three portions:
-
Input (or Raw Data)
-
Calculations
-
Output (or Model)
Let’s pick them up one by one:
-
Input (or Raw Data)
The raw data is the basic input required for a model. Your raw data may consist of several fields, not all of them might be required in a specific model, but it is a good idea to keep it clean and tidy. Here are some basic points to manage your input data.
-
Setup a separate sheet for data: A good model should have all of the raw data in a separate sheet.
-
If there are any calculated fields required for the final output, you can mark them with a slightly different font color or highlight them with a mid tone color.
-
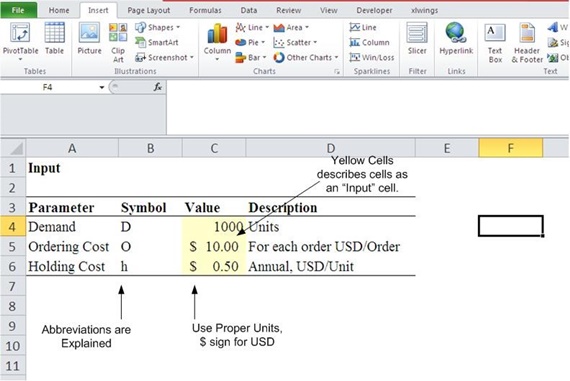
Use colors to differentiate type of data within your input data. In general, yellow fill cells are used for input data and the fields that are calculated may be filled with light shade of gray to imply that no data be input in such cells.
-
Keep formatting to minimal. This gives your model a more professional look, in general.
-
Convert your data into a table, this will help automatically update formulas in the output and the calculations sheet.
-
Calculation
This is the second step in building any model. With this sheet you put every bit on calculation here so that the final model is neat and clean. You can have several such sheets depending on the length of calculations and the model you are trying to replicate. Here are few tips to make the process easier for calculations sheets.
-
Don’t just start calculations, start from step one and go step by step to reach the final output.
-
Highlight cells to identify their purpose whether they contains formula, or needs an input or any thing else.
-
Don’t hard code data until you are sure that values are not going to change for example the value of pi can be comfortably hardcoded into a cell but the doing so for the age of a person is not correct.
-
Output or Model:
The final model should contain all the information you have designed it for, plus it should be presentable as well as easy to read. Remember following points when designing an output report.
-
Do not clutter your output with irrelevant information. Keep it simple and precise.
-
Use proper number formatting for outputs.
-
Use appropriate labels to make data easy to understand.
-
Use charts that show effect of one parameter over the other only for those parameters that have significant relationship between.
-
Keep all underlying calculation and data entry required to the specific sections.
-
You good combination of colors that add professional look to your model.
With all that said lets take up an example and see how we do it.
Example: Developing and EOQ Model in Excel
EOQ or economic order quantity is a very famous model (and also a very basic one). We can see how this model works when developed in excel.
D = Demand of a product
O = Ordering Cost
H = Holding Cost
And the formula for EOQ is: 
In the excel sheets, we need to put D, O and H as input in the sheet “Input”. See how cells are labeled with appropriate units and colored. Description makes it easier to understand the model.

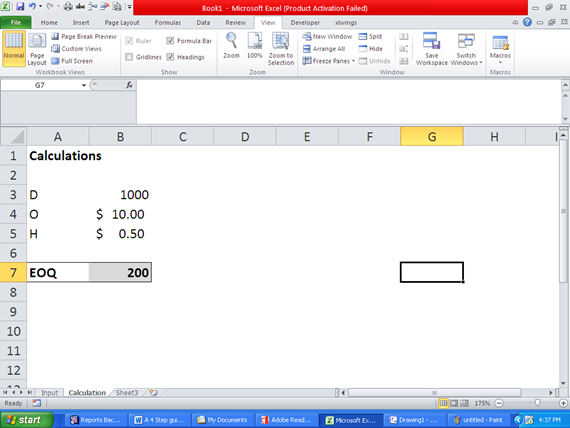
The calculations sheet looks like the one below. It shows the required to compute EOQ.

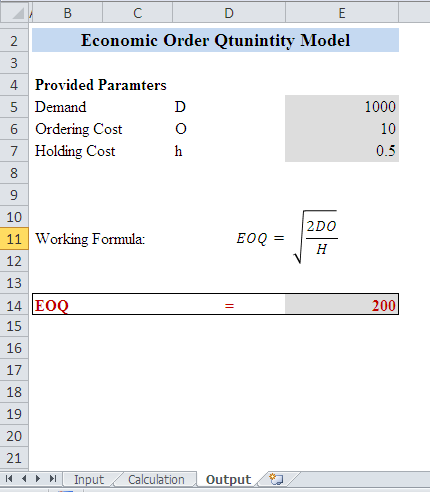
The output or Model: The following picture shows how an output should look like. It should be a ready to print sheet, with all relavenet information, assumpations and the final output reported on it. See how color coding is used to distingish the cells that are derived from Input sheet.

This completes our first basic model.

Related Tutorials

In real life, resources are scarce and wants are unlimited. This fact leads us to optimize our resources to get best out of available resources
Microsoft Excel Pivot Tables have many functions available through the option of Show Values As. One particular calculation can be used to display the Parent Row Total...

Excel sheets can surely make your work a lot easier. Undoubtedly, excel sheets is one of the professional tools for working with information ava...


Latest
-
Understanding How HYPERLINK Works In Excel
Excel has a built in function to create hyperlinks &...
-
Understanding how MS Excel Query Works
“Query” in MS Excel has same meaning as ...
-
An Introduction To Excel Power Map
Our today’s post is about “Power Map&rdq...
-
Using Pivot Charts For Displaying Data
Conventional charts are mostly used for displaying r...
-
Using “Calculated Items” For Analyzing A Pivot Table
In our last post, we explored how to use calculated ...