Understanding Scenario Manager

In Goal Seek, we try to reach a solution to a problem by iterating values. That was a case where we just needed one possible value that fits into the problem and gives us the solution. The problem arises when we try to check for multiple values and have to run the Goal Seek multiple times. There are situations where we are interested in multiple outputs, we are forced to use anther feature called Scenario Manager.
As the name suggests, the tools creates multiple scenarios by plugging in multiple values for multiple variable thus giving us an opportunity to compare them.
The feature is especially suitable for financial analysis, production schedules and solving other similar problems.
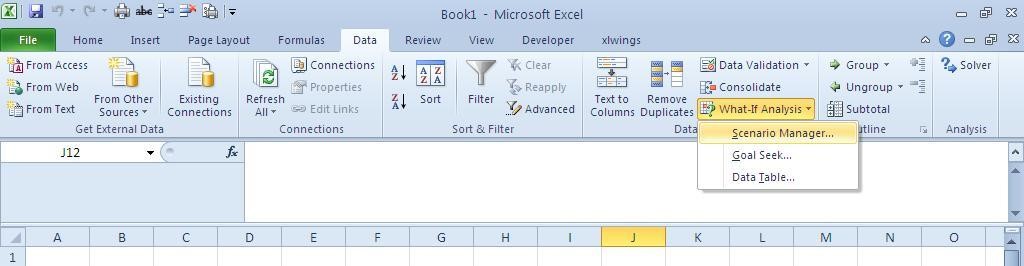
The feature can be reached by first installing Data Analysis add-in through Data>What If Analysis>Scenario Manager or by using shortcut key combination: Alt+A+W+S.

Let’s take up an example and see how we can setup a scenario manager.
 Example: The total cost of a product is the function of its fixed costs, variable costs and the number of units produced. The relationship is written as TC = FC + VC × Units. Whenever evaluating a business proposal we need to examine the TC to check its workability. An Excel sheet can be setup as shown in the following picture:
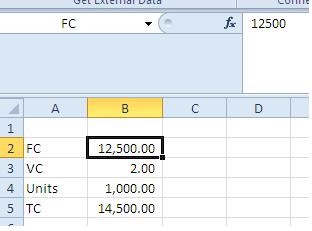
We have cells to hold values of Fixed Cost, Variable Cost, Units and resulting Total Cost.
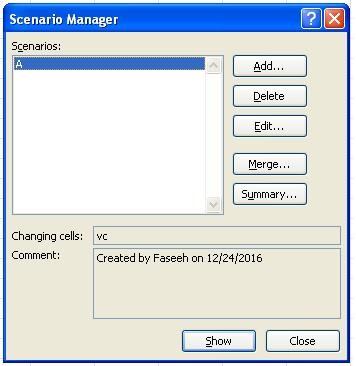
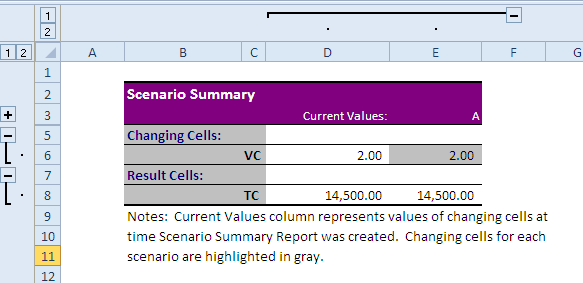
In order to make the final result more readable, we have named the cell in column B: B2 as FC, B3 as VC, B4 as Units and B5 as TC. This will be visible when we will print the scenario summary report.
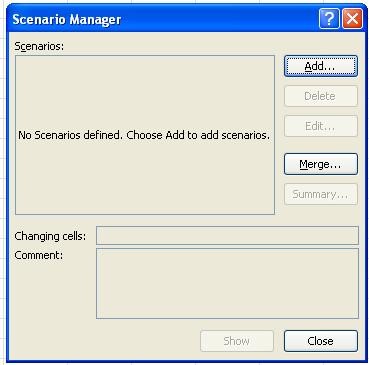
 Then we go to Data>What If Analysis>Scenario that leads us to the following dialogue box: then press Add button to add a scenario. The action will prompt another dialogue box asking for Scenario Name and the cells to be changed.
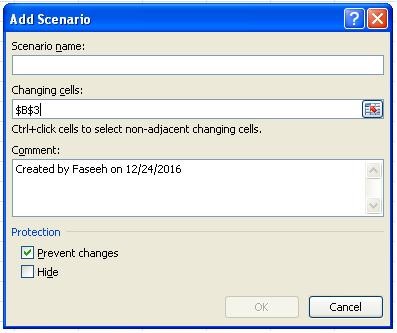
 You can name it as you like, the next option is to select the cell whose values will be changed. For our case this is B3 that hold the value for variable cost in the sheet.
There is also an option to add comments to the Scenario. It is always advised to use meaningful Scenario names that make understanding easier.
Finally when you press ok, you will be prompted for the last dialogue box of the series that will ask you for the value for the variable. When you are done with this you will be able to see the scenario in the scenario manger dialogue box like figure below.

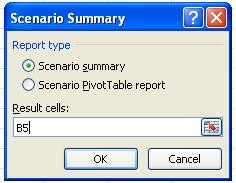
 Finally in order to print the report, you can press the button Summary and select the cell that will be printed as result. If there are multiple cells that will be changed by changing value of a single cell, you can always select them all. Additionally you can also print the final report as pivot table by selecting the second option. When pressing ok you will have a new sheet added to the existing sheet.
The final report will look like the following picture:

Thus you can add multiple scenarios and present it easily.

Related Tutorials

We encounter this problem of numbers behaving as text with commas when we import data from some other software in to excel sheet.

We frequently encounter data while working with lists. It is a common problem caused by human error as well as duplication of data due to common practices – copy...

MS Excel offers seven logical functions, today we will discuss how to use AND () when summing up values.


Latest
-
Understanding How HYPERLINK Works In Excel
Excel has a built in function to create hyperlinks &...
-
Understanding how MS Excel Query Works
“Query” in MS Excel has same meaning as ...
-
An Introduction To Excel Power Map
Our today’s post is about “Power Map&rdq...
-
Using Pivot Charts For Displaying Data
Conventional charts are mostly used for displaying r...
-
Using “Calculated Items” For Analyzing A Pivot Table
In our last post, we explored how to use calculated ...