Finding An Equation That Fits Your Data…

Whenever we have data, we are interested in getting some meaningful insights from it. Most of the time, we are either interested in predicting something, or in finding a relationship or causation between variables. Such a causation or relationship can be expressed as an equation.
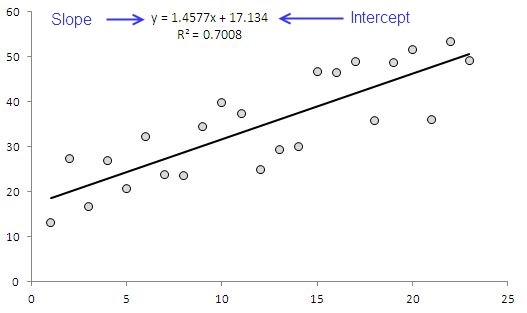
The example of such an equation is one that we display in charts – yes that is a mathematical representation of the relationship of two variables – how one varies with other, or what change in one cause a change in the other.
A relations between two variables can be represented by linear, quadratic or lastly, with polynomials. This post covers only exploring the “linear” relationship between variable.
To achieve this, we will be using two functions:
-
1-�SLOPE�()
-
2-�INTERCEPT�()
-
Assuming that we have two variables X and Y and that we are trying to develop a relationship between then, here is what we usually do and what we are trying to achieve through this post: we are trying to find the slope and the intercept of the equation that is automatically displayed when equation is displayed on charts.
THE SLOPE FUNCTION:
This function returns the first part or m of a linear equation. It takes values of X and Y as argument – has following syntax
=�SLOPE�(known_y's, known_x's)
Where X and Y have their usual meanings.
THE INTERCEPT
The intercept for y=mx+b is the point where line cuts y-axis. In excel we calculate this value with �INTERCPET�() function. This function takes following arguments:
�INTERCEPT�(known_y's, known_x's)
WORKING OUR FORMULA
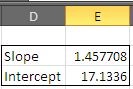
Consider the data in the sample sheet, we can setup formulas in two separate cells for Slope and Intercept values:
|
Parameter |
Formula |
Result |
|
Slope: |
=�SLOPE�(B2:B24,A2:A24) |
1.457 |
|
Intercept: |
=�INTERCEPT�(B2:B24,A2:A24) |
17.133 |
This is same as we have seen initially in the chart – produced by selecting option to display the equation on the chart.
With this short trick – we can find a relationship between variables, without needing to plot them.
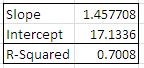
Additional Tip: How good is your line fitted?
With chart, it is easy to see how good the line is fitted to the data, but without chart, while using the formulas, it is difficult to estimate it.
We can use �RSQ�() to find this figure – as a general rule, the higher the value, the closer is the fit and the values varies between 0 and 1. �RSQ�() has syntax similar to the other two formulas we have used that is:
�RSQ�(known_y's, known_x's)
The result is 0.7008 as displayed in chart.
You can download the sample file and see how things work!!

Related Tutorials
Whenever we have data, we want to extract meaningful information from it.

We encounter this problem of numbers behaving as text with commas when we import data from some other software in to excel sheet.

When we are developing a model or trying to test some formula, we need data and when we don’t have one, we have to create it to suit our needs. This is frequentl...


Latest
-
Understanding How HYPERLINK Works In Excel
Excel has a built in function to create hyperlinks &...
-
Understanding how MS Excel Query Works
“Query” in MS Excel has same meaning as ...
-
An Introduction To Excel Power Map
Our today’s post is about “Power Map&rdq...
-
Using Pivot Charts For Displaying Data
Conventional charts are mostly used for displaying r...
-
Using “Calculated Items” For Analyzing A Pivot Table
In our last post, we explored how to use calculated ...